
- Introduction
- Blogging Statistics & Impacts on SEO Performance
- On-Page SEO Factors & Keywords
- Website Features
- Off-Site SEO Factors: DR, UR, Links & Referring Domains
- References
Introduction
Recently at Zahavian Legal Marketing, we analyzed thousands of law firm websites and analyzed the top 30 results ranking for high-competition keywords across 40,000 Google search results and over 20,000 ranking pages.
The primary objective of this study was to investigate the macro signals On-Page and Off-Page SEO signals that impact Local SEO in the hyper-competitive legal industry. So, while this study focused on analyzing local law firm websites, these findings are not only directly applicable to law firms, but many findings are universally applicable to SEO and particularly Local SEO.
Our method for conducting this study relied on custom-programmed python scripts to crawl and analyze webpages as well as Ahrefs data. Therefore, here are some key acronyms to familiarize yourself with:
- DR – Domain Rating
- UR – URL Rating
- RD – Referring Domain
- BL – Backlink
Blogging Statistics & Impacts on SEO Performance
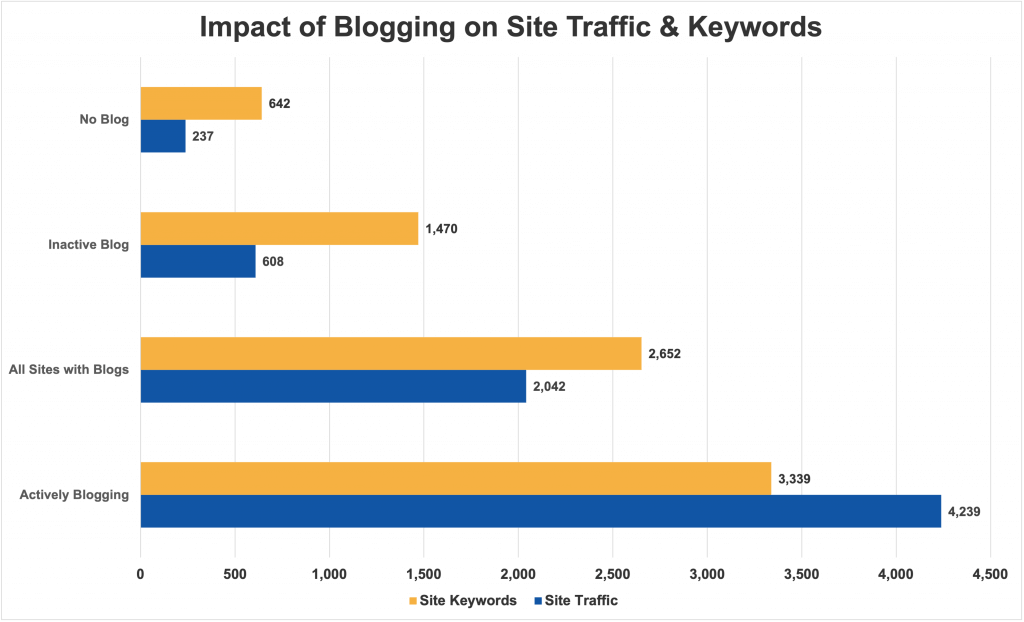
Law firms that actively blog on their website generate far more traffic than those that do not actively blog and those that do not blog at all.
- Websites ranking in the top 30 positions that didn’t blog generated an average of 237 organic monthly search visitors.
- It was found that law firms that had blogged (active & stale) on their website generated 7.6 times more organic search traffic than sites without blogs.
- Furthermore, law firm websites that actively blogged were found to have generated 16.9 times more organic search traffic than law firms that did not blog.
- Firms that actively blogged on their sites generated nearly 6 times more traffic than firms with inactive blogs (stale).
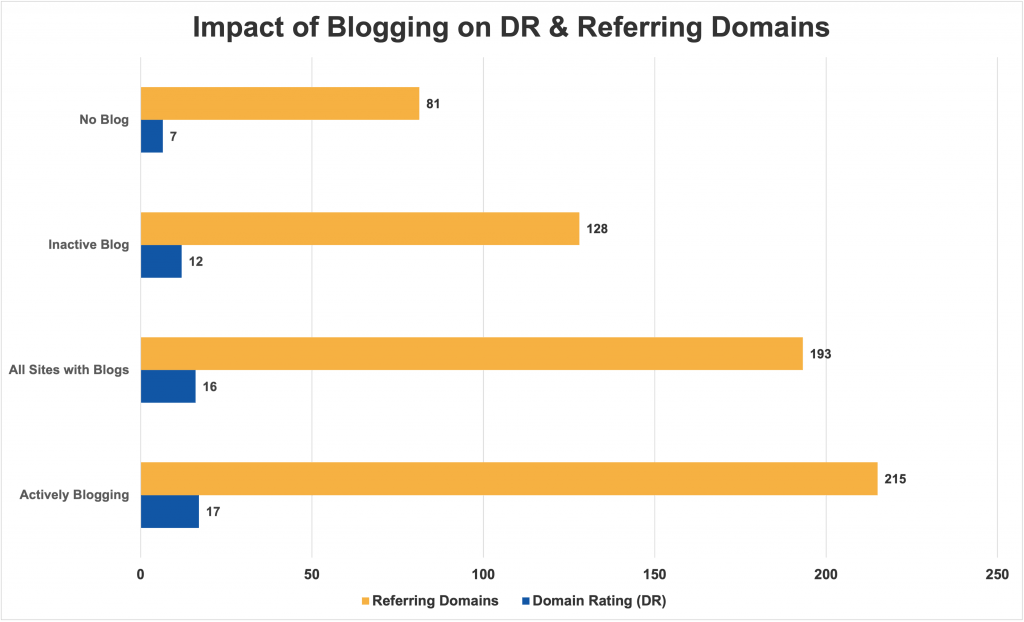
Websites that blogged also benefited from overall off-site SEO signals too.
- Websites that actively blogged have 2.6 referring domains for every 1 referring domain for sites with no blog.
- Actively blogging sites also averaged a DR (Domain Rating) of 17 compared to a DR of only 7 for sites without a blog.
- The sites with active blogs also had 68% more referring domains than inactive blogs and averaged a DR 5 points higher than inactive blogs.
- While the facts are clear that blogging on a consistent basis yields best results, aged, inactive blogs still benefited with 57% more referring domains than websites with no blog.
On-Page SEO Factors & Keywords
Keyword Density
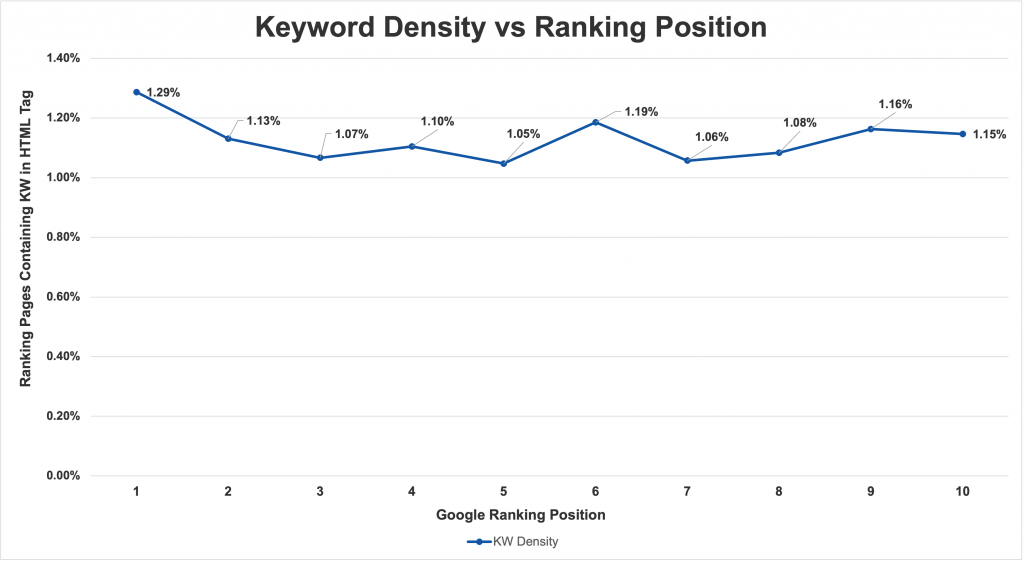
- Pages ranking 1-10 in organic search results averaged between 1.05-1.29% keyword density.
- On average, the highest keyword density was 1.29% and represents pages ranking #1 on Google.
- There was no positive, direct correlation between ranking position and keyword density, simply the range.
- The average Keyword Density of:
- Top 10 results: 1.13%
- Positions 11-30: 1.26%
- Top 30: 1.22%
Key takeaways:
- Optimize keywords density for approximately 1.05-1.29% of total page content (word count). Do not over or under-optimize.
- More keywords than that on page likely won’t get you rankings, rather make content quality seem spammy or that you’re trying to trick Google into ranking.
Title & H1 Tag Length vs Ranking Position
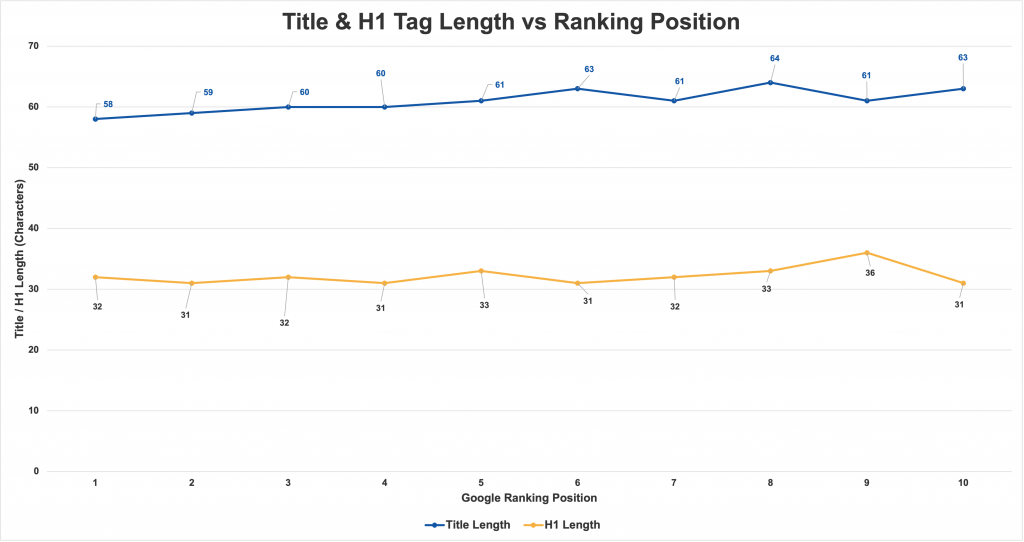
Title Tag Lengths
- There’s a slight positive trend of higher-ranking pages having slightly shorter Title tags. The Top 3 ranking positions have average title lengths of 58, 59 and 60 characters, respectively.
- The Top 5 positions (#1-5) have average title lengths of 60 characters long.
- The bottom 5 have average title lengths of 62 characters.
H1 Lengths
- H1 (Heading 1) tags did not show a clear trend between length and ranking position.
- The Top 3 positions had H1 lengths of 32, 31 and 32, respectively.
- Top 10 results average is 32 characters long.
- While not surprising, H1 tags were approximately half the length of their corresponding title tags (32 vs 62 characters on average).
URL Length vs Ranking Position
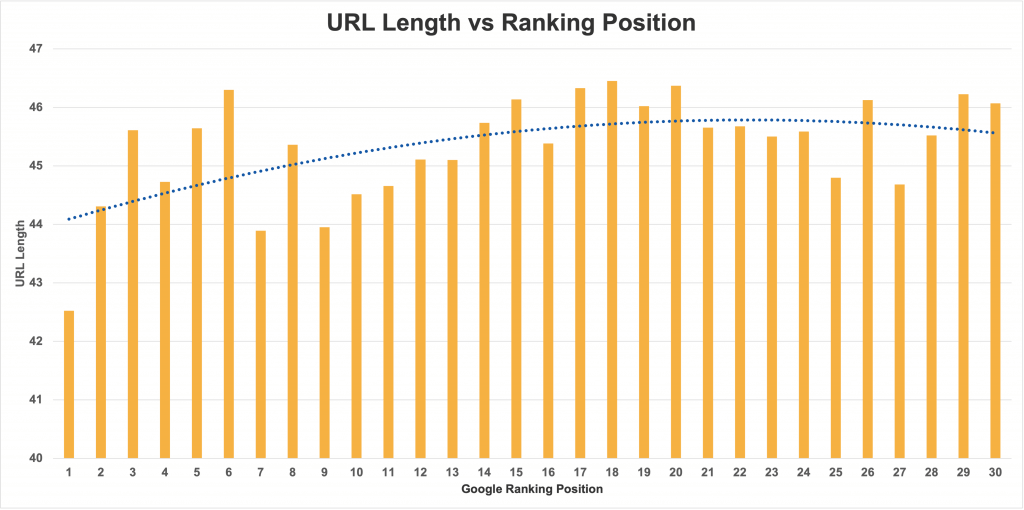
The graph above shows a slight trend toward shorter URLs ranking higher when all URLs are keyword-optimized.
- The average URL length (including the domain and path) ranking #1 on Google for highly competitive keywords is 42.5 characters long.
- The average URL length of pages ranking in the Top 3, Top 5 and Top 10 results are 44.1, 44.6 and 44.7, respectively.
There are 4 points which are interesting to note:
- Note how narrow the range in URL length is between the pages ranking on page 1 to 3 of the search results are. The average URL length in the Top 30 results was 45.5 characters long (only 3 characters longer than the average ranking in position #1) with a Standard Deviation of 0.896 characters.
- There is a trend in which shorter, keyword-optimized URLs tend to rank higher in Google’s search results.
- Domain length, which excludes protocol and subdomains (i.e. “www”), actually slightly decreased from higher to lower rankings, but overall averaged between 17.3 and 18.2 characters in length. The better optimized and shorter URLs enjoying top rankings were not given advantage by having shorter domain names.
- This data should not be taken as a primary ranking signal. While we and many other agencies work on optimizing URLs and keeping them short, descriptive and clean, there is another explanation for this observed trend. If you look at the graph % Rankings Occupied by Homepage, you’ll notice that there’s a slight positive relationship of homepages occupying higher rankings for the competitive Local SEO keywords used to create this study. Since homepages have shorter URLs, this could explain the phenomenon observed in this graph.
Keyword Optimization in Title, H1 & Subheadings
The following chart looks at the presence of the keywords in critical On-Page element / HTML tags for the ranking pages. Keyword presence for each element was measured by ensuring that all parts of the keyword (e.g. “city/location” and “service/specialization/practice area”) were present in the HTML tag.
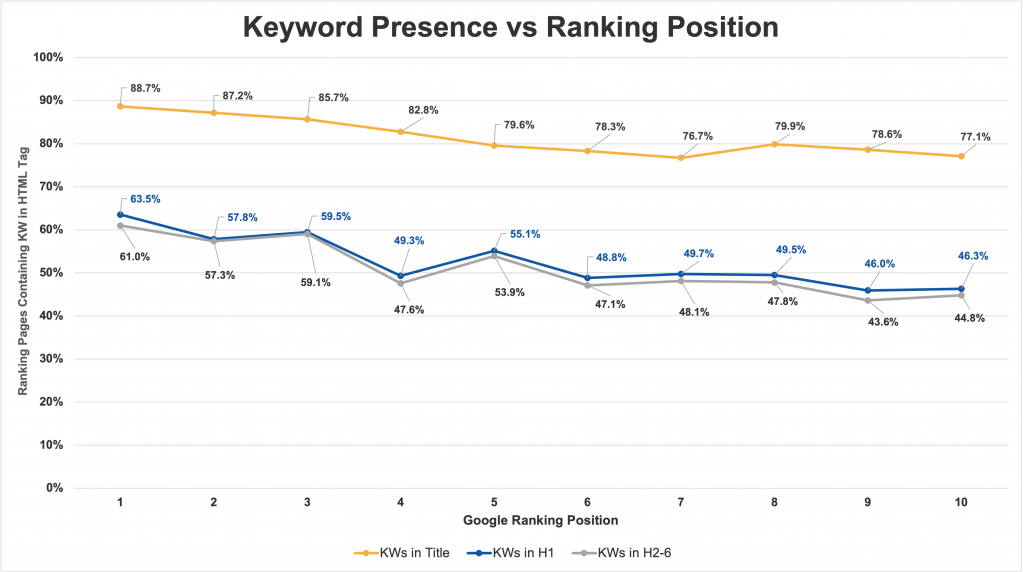
There is a positive and direct correlation between the Google ranking position and the keyword presence in Title, H1 through H6 title tags.
Title tags
Title tags were observed to have the highest presence of the primary keyword in them.
- 88.7% of pages ranking in the coveted organic position #1 had the main keyword (or a slight variation) in the Title tag.
- 87.2% and 85.7% of pages ranking in positions 2 and 3 contained the main keywords, respectively, in their Title tags.
- Pages ranking in Positions 5-10 all had the main keyword in their Titles less than 80% of the time.
- Pages ranking in positions 7 and 10 had the lowest frequency of main keywords in Title tags, with 76.7% and 77.1%, respectively.
Heading 1 & Subheadings (H2-H6)
- H1 tags, being known to be the next single most important on-page HTML tags for which to optimize, also followed a smooth trend for the most part.
- Pages ranking in position #1 were most frequent to include the main keyword in their H1 tags and contained those keywords 63.5% of the time.
- There was a very tight correlation between pages optimized with keywords in the H1 tag and at least on subheading (h2-6) which included the main keyword.
- Title tags contained the main keyword approximately 25-35% more often than h1-h6 headings.
Homepage vs Inner Page Rankings
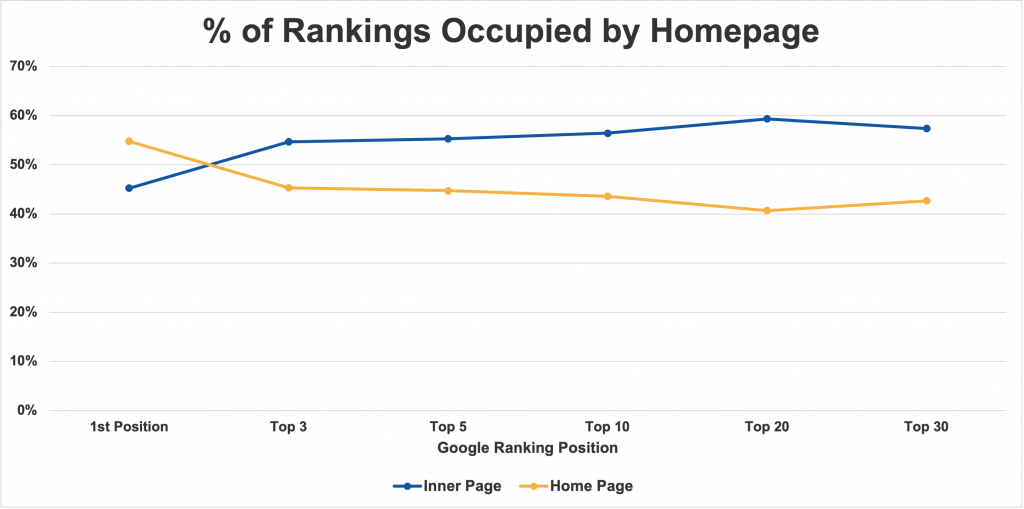
- Homepages overall outperformed inner pages when it came to ranking #1 on Google for their main keywords (54.8% vs 45.2%).
- In other words, homepages had a 10% advantage ranking #1 for their primary, high-competition search term.
- This is supported by the fact that homepages tend to have higher link signals (UR), backlinks and referring domains than inner pages.
- Beyond position 1 in the search results, things flip.
- The Top 3 results saw nearly 10% more inner pages rank than homepages (54.7% vs 45.3%).
- The same trend is observed for the Top 5 (55.3% vs 44.7%), Top 10 (56.4% vs 43.6%) and so on.
- Positions 2-10 on page 1 of Google organic search results consisted of 57.0% inner pages and 43.0% homepages. That’s a 14% difference.
Note: Look at other graphs and analyses in this report to understand what makes an inner page or a homepage rank higher. There are significant differences in word count, UR, referring domains and DR that likely contribute to the battle for high rankings between homepages and inner pages.
Content Length & Word Count
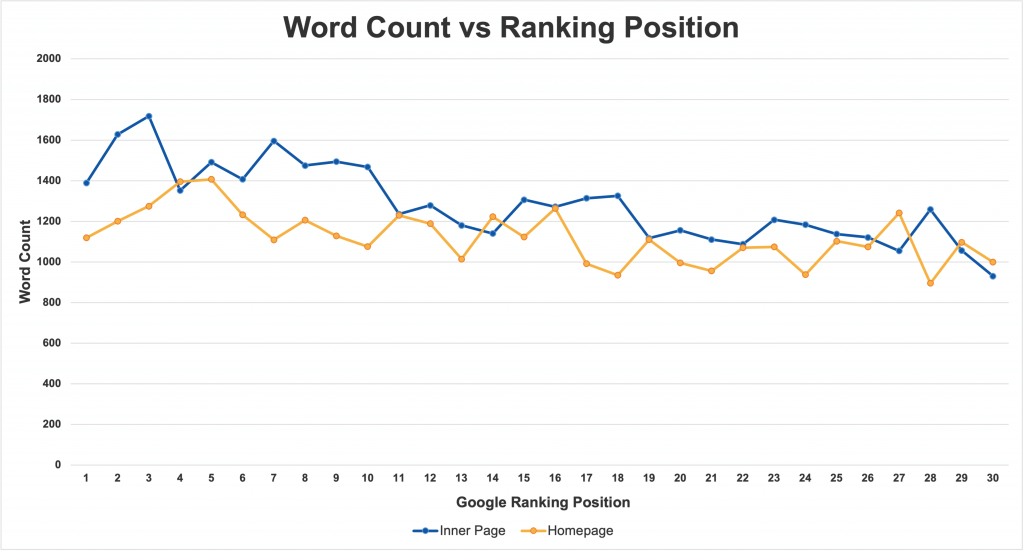
There are several phenomena observable in this graph plotting word count against ranking position. There were slight positive trends between ranking position and word count. Higher word counts correlated with higher page rankings, with some caveats:
- Word count played a bigger role on inner pages ranking on page 1 than home pages.
- The trend between higher word count and higher rankings isn’t as strong as other factors, such as On-page optimizations to Title, H1 and H2-6 tags, nor Off-page signals such as backlinks, referring domains, UR (URL Rating) and DR (Domain Rating).
- That said, the average page ranking in position 1 averaged 1,242 words and the Top 3 results averaged 1,412 words.
- All pages ranking on page 1 (Top 10) averaged a word count of 1,377.
- Which was 17% higher word count than the webpages ranking on Page 2.
- 27% higher than those on Page 3 of Google.
- Homepages were able to rank in the Top 10 results on page 1 with significantly fewer words than inner pages.
- Inner pages that outranked their homepage counterparts in Position 1 had 24% longer content (word count).
- They were 32% longer in the Top 3.
- 18% higher word count in Top 5.
- 24% longer overall on Page 1 (top 10).
Key takeaways:
- Longer content (higher word count in the form of valuable, in-depth content) does improve rankings overall.
- It makes a more significant difference when ranking an inner page than the homepage.
- For best results, longer form content must be combined with other SEO factors, such as optimizing On-Page elements such as HTML tags and improving Off-Page signals, such as domain authority (DR), building more quality backlinks/referring domains and increasing UR.
Page Speed
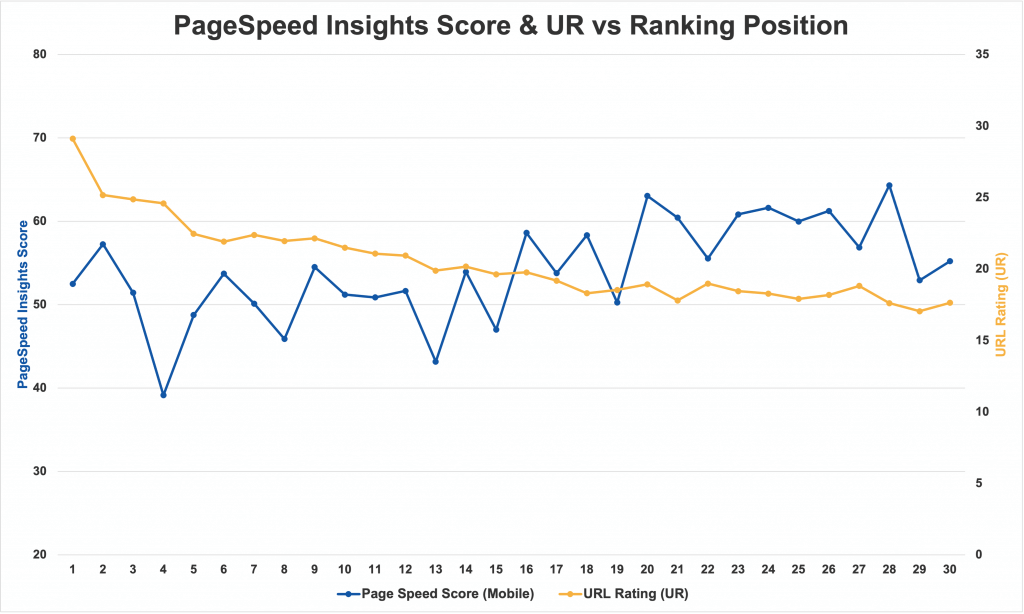
The above chart shows the relationship between the ranking pages’ positions in the Google organic search results plotted against Mobile PSI (PageSpeed Insights) scores and UR (URL Rating) scores.
- The Mobile PageSpeed Insight Scores for the Top 3 organic results on Google averaged out to 53, 57 and 51, respectively.
- There is not a notable positive trend between ranking positions and higher PageSpeed Insight scores for mobile.
- Interestingly, aggregated Mobile PSI scores were slightly higher for pages organically ranking in positions 20-30, with an average score of 59, compared to an average score of 50 for the Top 10 organic Google search results.
Contrast that with the UR (URL Rating) scores aggregated by organic rankings and a positive trend between higher UR scores and rankings is observed (as noted in other parts of this study).
While Zahavian Legal Marketing and other local SEO agencies (particularly, law firm marketing agencies) known for driving exceptional SEO results for law firms, have been known to focus on producing websites with PSI Mobile scores in the 80’s, 90’s and 100’s, the general trend shows that to date it is still not as important of a SEO ranking factor as things like backlinks and content. The data indicates that this ranking factor is considered by Google’s search engine rankings algorithms to be more of a “tie-breaker” than a major ranking factor.
Website Features
In our Local SEO study of thousands of law firm websites and over 10,000 ranking pages ranking in the top 30 results for some of the most competitive keywords in law firm search engine marketing, we did an intensive analysis on many aspects of law firm websites.
WordPress Usage
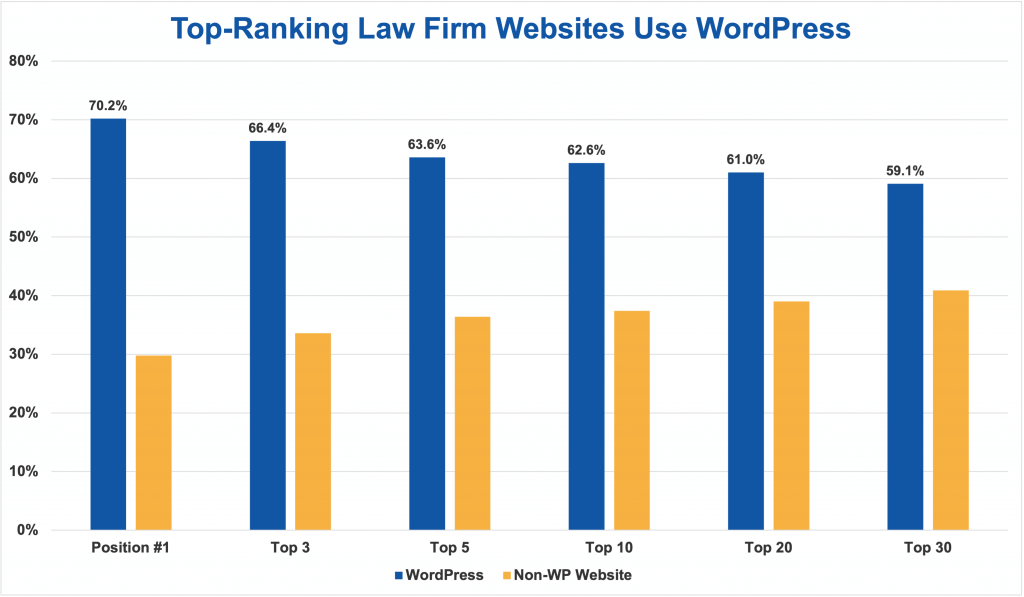
- 59% of all law firm websites ranking in the top 30 positions use WordPress
- Over 70% of law firm sites ranking #1 run on WordPress
- 66.4% in the top 3 positions run on WordPress. In other words, 2 out of 3 of the law firm websites in the top 3 positions run WordPress.
- 63.6% and 62.6% of firm sites rankings in Top 5 and top 10, respectively run on WP.
- The portion of websites running WordPress increases with the ranking position.
- While WordPress doesn’t provide special SEO abilities out of the box, the stats speak to how serious SEO and digital marketing agencies turn to WordPress to rank law firms on page 1 of Google.
User Accessibility
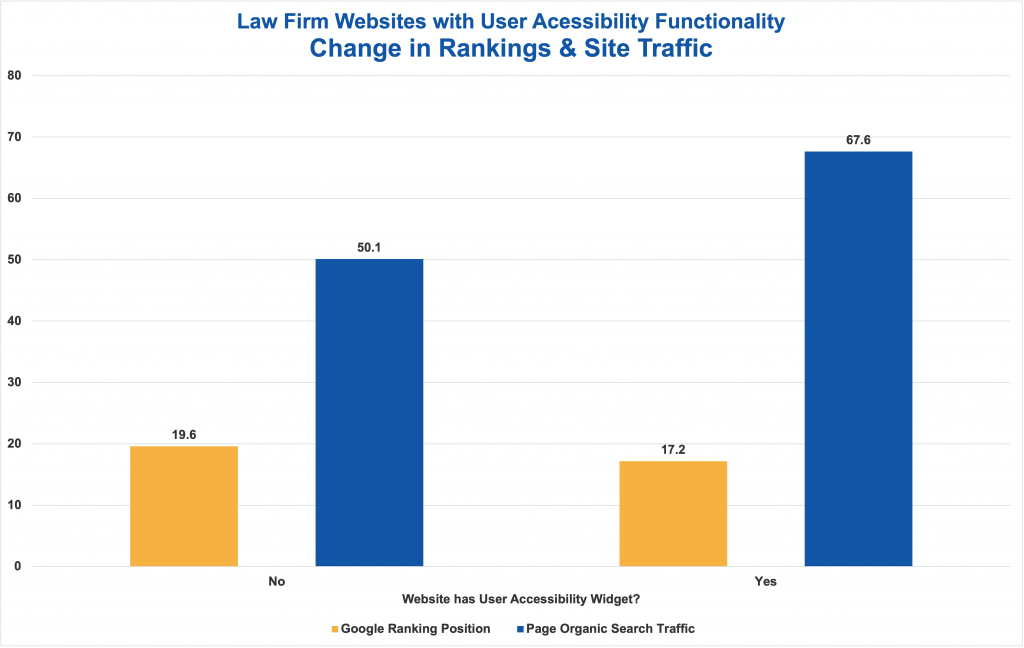
- Websites that have a user accessibility widget were found to rank 2.4 positions higher than websites without them.
- As a result, those pages that ranked higher with the user accessibility plugins benefited from 34.9% more organic search traffic than sites without User Accessibility features.
- Yet, websites with user accessibility features did not have higher DR or UR scores. In fact, the average UR scores were 18.9 and 19.7 for websites with and without UA functionality, respectively.
- This represents an opportunity for law firm websites and other local businesses that rely on the web to generate new business since we found that less than 5% of websites are using User Accessibility plugins and widgets.
Off-Site SEO Factors: DR, UR, Links & Referring Domains
Site Traffic & DR
This analysis was performed by taking law firm websites with 500 webpages and less to remove large sites (and large firms) that would have skewed the data from focusing on small, local firms. Keep in mind that this data is for overall very competitive local SEO keywords. Additionally, the competition of these keywords varied greatly, too. So, this data should be used to understand the relationship between backlinks, domain authority (DR) and ranking positions in general.
Websites that work to increase their web presence and site’s authority benefit from higher ranking positions and overall, more traffic. As site authority (DR) decreases, so do ranking positions, and generally, organic search traffic.
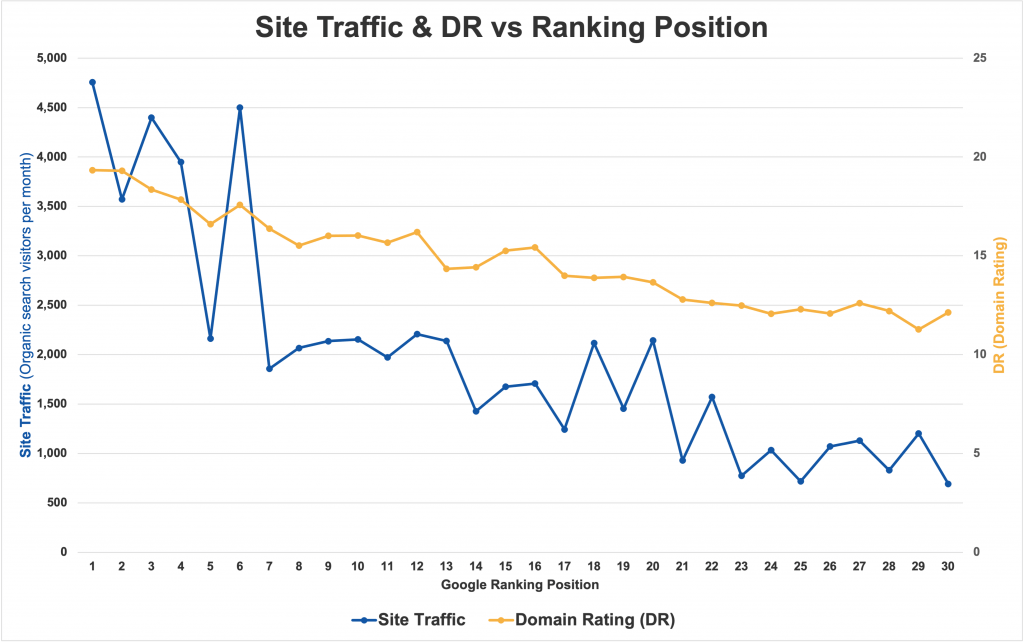
- Sites that ranked in the Top 3 results for their primary keywords had DR scores of 18-19 on average and generated an average of 4,242 monthly organic search visitors.
- Sites ranking 4 or 5 generated 3,056 monthly organic traffic.
- Sites in the bottom half of page 1 (6-10) generated 2,543 monthly search visitors.
- Sites ranking on page 3 still generated 2,183 organic monthly visitors.
There are several things that can be observed from this:
- Sites with higher DR (authority) won higher rankings in Google organic search results.
- Sites with higher rankings generally tend to get more traffic due to more traffic going to the higher rankings of the main keywords measured in the study.
- Sites with higher DR generated more traffic overall, from many keywords.
- While sites ranking on pages 2 and 3 didn’t receive traffic for the main keywords analyzed in this study, they still benefited greatly from SEO and relied on a smart strategy of ranking for secondary keywords that still drove business value (see more on this in blogging below).
Referring Domains & DR
This figure shares a common graph (DR shown in yellow) with the Site Traffic & DR vs Ranking Position. However, instead of plotting it along with traffic, it’s plotted with Referring Domains to show the strong relationship of the number of Referring Domains linking to a local law firm’s site and its DR score.
Like Site Traffic & DR vs Ranking Position, this figure was used on sites with 500 pages or less to keep the relevance on smaller firms and local businesses.
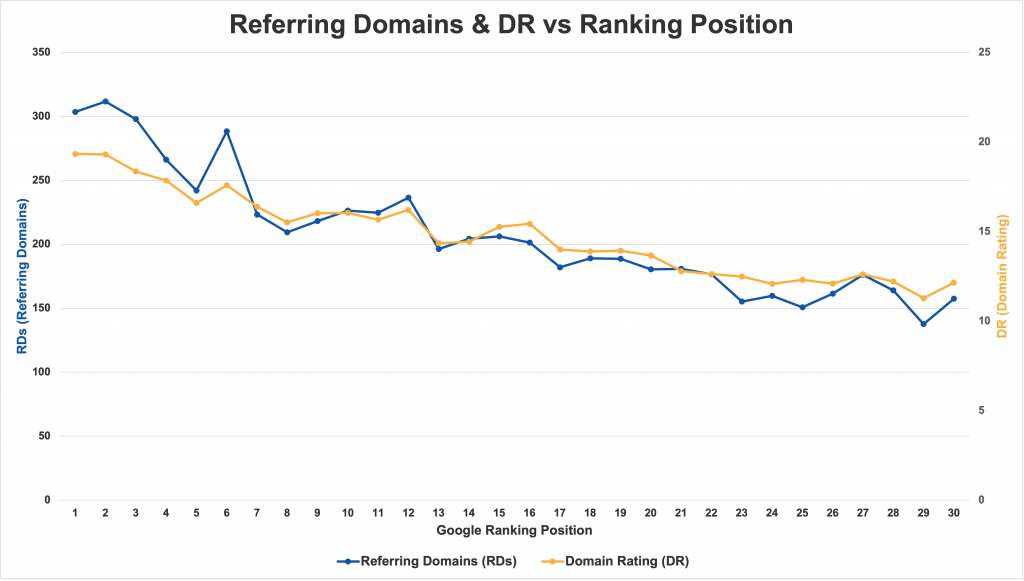
- Websites with a page ranking #1, 2 and 3 organically on Google had an average of 304, 312 and 298 referring domains, respectively. Those sites also averaged DR scores of 19, 19 and 18.
- Websites ranked in position 10 at the bottom of page 1, averaged a DR of 16 and had 226 referring domains linking to them.
- Websites ranked in position 20 averaged a DR of 14 and had 180 referring domains.
- Websites ranked in position 30 averaged a DR of 12 and had 158 referring domains.
- A notable trend seen in this plot is how backlinks from quality referring domains is one of the most pronounced SEO ranking factors.
- There’s a positive and direct correlation between a site’s DR score, # of Referring Domains and its ranking position in the Google search results.
UR & DR vs Ranking Position
UR scores by ranking position showed a relatively steady trend between higher URs tied to higher rankings.
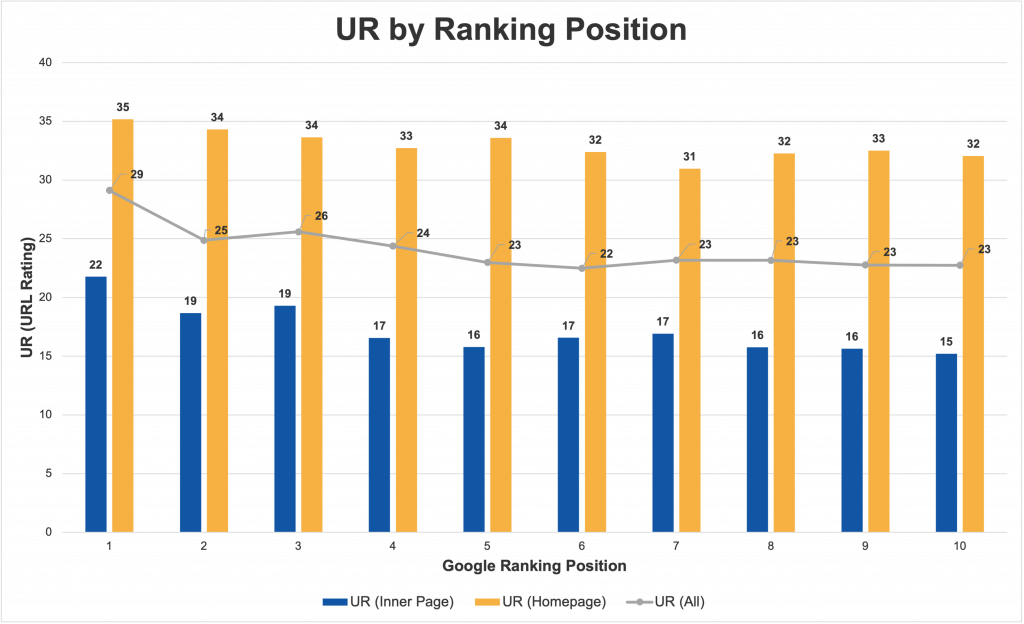
- Across all high-competition keywords included in the study, the average page ranking in position #1 on Google had a UR of 29.
- URs varied significantly depending on whether the homepage or an inner page was ranking, with homepages having significantly higher UR scores than inner pages.
- Homepages ranking #1 in the results averaged a UR score of 35.
- Inner pages ranking #1 averaged a UR of 22.
- Homepages ranking 2-5 ranged averaged URs of 33-34.
- Their inner page counterparts ranked in the same positions with URs between 16-19.
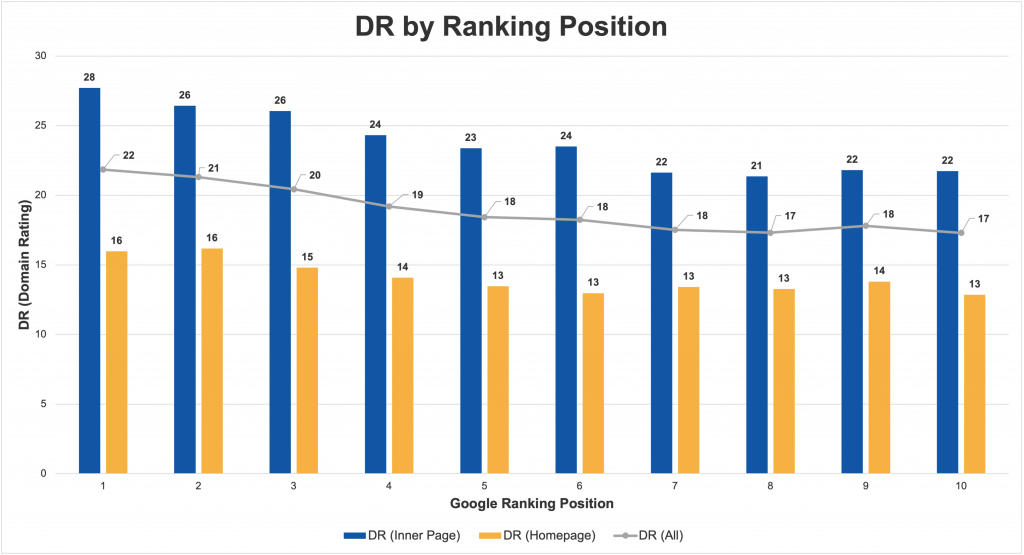
Compared to UR vs Ranking Position, this chart showing the relationship between DR and Google Rankings shows a slightly stronger correlation.
- Pages ranking on page 1 range in average DRs of 22 down to 17, decreasing with lower rankings.
- Positions 1, 2 and 3 were occupied by sites with aggregate DRs of 22, 21 and 20, respectively.
- Inner pages that ranked had significantly higher DR scores than Homepages.
- Inner pages ranking #1 on Google averaged site DR scores of 28, whereas the homepages ranking averaged DRs of just 16.
- Inner pages ranking 2-5 ranged in DRs of 26-23
- Homepages ranking in those positions had DRs between 16-13.
- When analyzing this in conjunction with UR by Ranking Position and Word Count by Ranking Position, the data makes sense.
The following observations one can make analyzing these 3 charts together (UR by Ranking Position, UR by Ranking Position, and Word Count by Ranking Position). For any given position on Google (particularly the top 10), inner pages rank when:
- The site has a higher DR score. For instance, the average inner page had a DR score 12 points higher (or 75% higher) than homepages ranking #1.
- The page has a lower UR score. Inner pages ranking 1, 2 and 3 on average had UR scores that were 13, 15 and 15 points lower (or 37% lower) than home pages.
- The page has a higher word count. Inner pages ranking in the top 3 organic search results were 32% longer in word count than homepages ranking in the top 3.
Potential Reasons for this trend: It’s important to first state that the following are simply conjectures based on the data analyzed in this study. Without looking into Google’s “blackbox” search engine algorithms (which are constantly changing), one cannot know for certain. However, due to the steady trends and strong correlations observed, some reasonable hypotheses for best practices and tactics can be made.
- UR and DR are both strong trends and indicators of a site’s or page’s ability to rank. Note that anchor text is unmeasured in this study. It is not known if all or what portion sites and pages analyzed are well optimized for anchor text. However, UR and DR, provided sites are being linked to by other quality sites, are good SEO metrics for determining a page’s ranking potential.
- DR and internal links have a greater impact than what’s reflected from UR. While UR takes internal and external links into account, to simulate Google’s PageRank formula. While it is only an approximation, Ahrefs, like Google, count internal links differently than external links. The fact that inner pages rank on page 1 with a DR score 75% higher and a UR score 37% lower means that Google might potentially count internal links toward a higher PageRank than Ahrefs calculates for in its UR score.
- More In-depth content (longer/higher word count) makes pages more competitive and rank-able. Inner pages with lower URs were shown to outrank home pages with higher DRs. Those same pages were notably longer in content.
- UR and DR as discussed in point 1 are certainly excellent indicators of a page’s ability to rank, all else being equal.
- It’s likely that both points 2 and 3 are valid as is seen in the data. However, to what extent is difficult to know. For one, this could be more specific to Local SEO, where DR and UR scores are lower and less sensitive in ranking power than higher DRs and URs (since these metrics are on a logarithmic scale) and local businesses with online web and search presence tend to be small businesses rather than large name-brand or industry leading names. Therefore, given the size and knowledge ahrefs has about the entire web compared to this segmented study, their UR and DR calculations are likely best suited for broader application than just Local SEO, which has its own unique factors and trends.
Number of Referring Domains by DR (Domain Rating)
Websites included in this study were analyzed based on the number of their referring domains and DRs (Domain Ratings). In this analysis, we included websites between DR 0 and 75. Note that the dataset consists of 62% Dofollow referring domains.
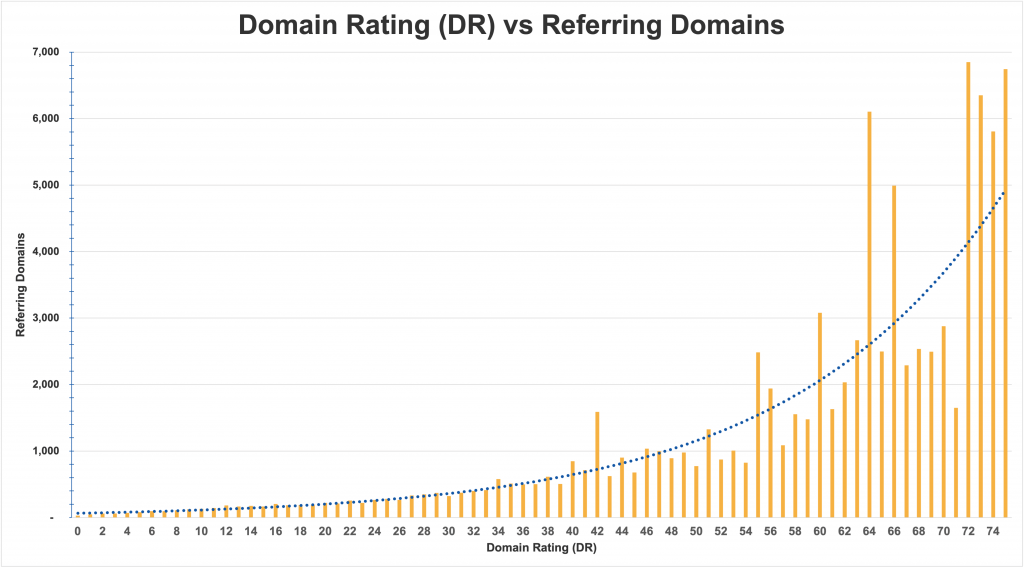
- Websites with DR 0, 1 and 2 on average had 29, 49 and 61 referring domains, respectively.
- DR 10, 15 and 20 websites had an average of 131, 164 and 220 referring domains linking to them.
- DR 25, 30 and 35 websites averaged 281, 322 and 512 referring domains.
- Beyond DR 40 sites, more anomalies between the number of referring domains and DRs are observed in the graph. In other words, we can see how the number of referring domains is significantly higher or lower than the trendline.
- Example: DR 42 websites averaged 1590 referring domains (over trendline) while DR 50 websites averaged 774 referring domains. This is due to the number of 1) # of Dofollow domains linking to the website and #2) the quality (DR) of those Dofollow referring domains.
- DR 40-49 websites required approximately 620 to 1,000 referring domains (excluding significant anomalies), or 620 to 1,590 referring domains including anomalies.
- DR 50-59 websites averaged between 774 to 2,484 referring domains (including anomalies). However, removing anomalies, the range was 774 to 1,942 referring domains.
- DR 60-69 websites averaged between 1,631 to 6,104 referring domains. This is the most significant jump in the number of referring domains linking to these websites.
This demonstrates the logarithmic nature of ahrefs.com‘s DR score. It takes significantly more referring domains (multiples) to incrementally raise the DR.
Page Backlinks & Referring Domains by UR (URL Rating)
Ranking pages with UR scores up to 50 were included in this part of the study. This is due to the fact that above a UR of 50, the number of pages to be measured exponentially decreases with each incremental UR score. Therefore, it was determined that this could lead to unreliable data.
Keep in mind that 62% of all referring domains in this dataset are Dofollow. So, the backlinks and referring domains mentioned here are total (dofollow, nofollow, sponsored, ugc, etc.). So, keep in mind that on average, 38% of these backlinks and referring domains are not contributing to UR.
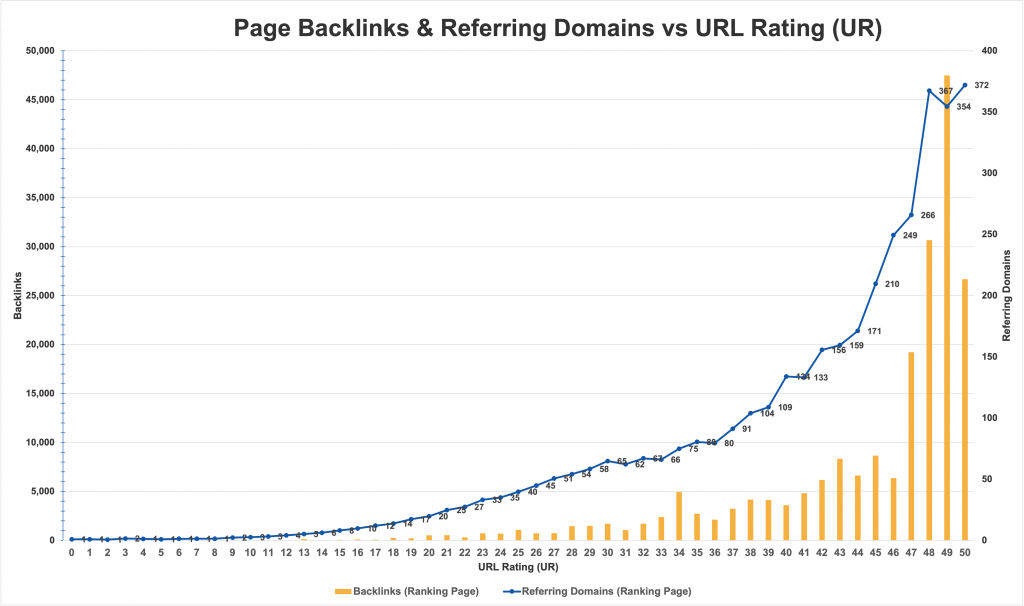
Pages with an average of:
- UR 10 has 3 Referring Domains with 19.1 Backlinks linking to it.
- UR 15 has 55.7 backlinks linking to it via 8 Referring Domains.
- UR 20 has 525 backlinks or 20 Referring domains linking to it.
- UR 25, 30 and 35 have 40, 65 and 80 referring domains linking to them, respectively.
- UR 40-45 have 134-210 referring domains, respectively.
- UR 50 have an average of 372 referring domains linking to them.
Keep in mind that UR scores are contributed by both internal and external links, with external links having a significantly larger impact on the score.
References
Learn about Ahrefs’ Scores used in this study: